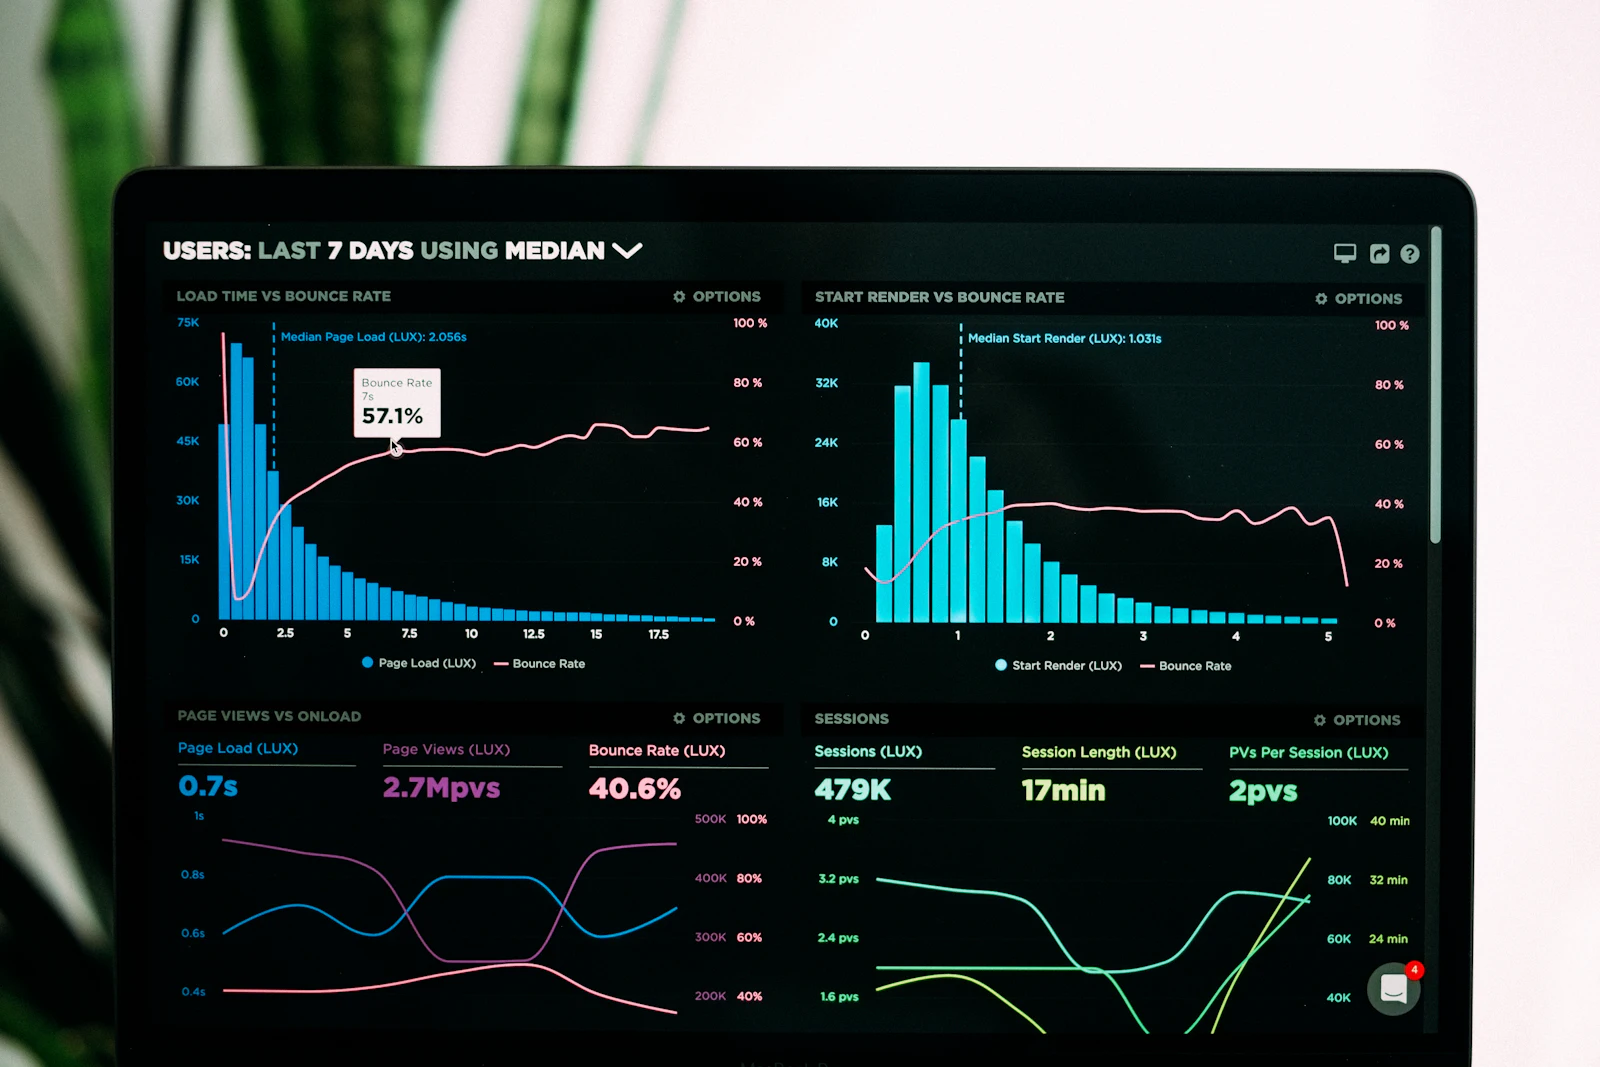
Monitoring and alerting: metrics, logs and alerts that require action
We set up metrics, logs, dashboards and alerts for your servers and services. Alerts go to Telegram or Slack, and each one says what is broken and what to do. The aim is that you learn about a problem from the monitoring, not from a user.
When you need this
- 1
You learn about outages from users
- 2
To find an error, someone has to SSH into servers and grep logs
- 3
Alerts exist, but there are so many that everyone has muted them
- 4
A disk filled up or a certificate expired and nobody saw it coming
- 5
A release went out and nobody can tell whether it made things slower
What's included
Metrics
Prometheus or VictoriaMetrics collects metrics from servers, Kubernetes, databases and queues. Your applications are scraped too if they expose metrics; if they do not, we help to add them.
Logs
Grafana Alloy ships logs from servers and containers to Loki. Logs are searched in Grafana next to the metrics, and retention is set to the period you choose.
Dashboards
Grafana dashboards built for your services: request rate, errors, latency, queue depth, resource usage. They are stored as JSON in the repository, not assembled by hand in the UI.
Alerts
Rules for symptoms that users feel, such as errors, latency and unavailability, and for causes that can be predicted: a disk filling up, memory, expiring certificates. Alertmanager routes them to Telegram, Slack or email.
Uptime checks
Public endpoints are checked from outside your infrastructure, so an outage is noticed even when the monitoring server is down together with everything else.
Runbooks
Each alert links to a short instruction: what it means, where to look, what to do first. The person on duty does not have to guess.
The whole system on one screen
Service health, traffic, deploys and alerts — the dashboards we set up for every project.
Service overview
- Services
- 12
- Healthy
- 12 / 12
- Deploys today
- 7
- Open alerts
- 0
Requests per second
All services, 5 min average
p95 latency, ms
Alarm threshold 250 ms
Service health
| Service | Status | Pods | CPU |
|---|---|---|---|
| api-gateway | Healthy | 6 / 6 | 41% |
| billing | Healthy | 3 / 3 | 28% |
| worker-pool | Healthy | 9 / 9 | 63% |
| postgres-main | Healthy | 2 / 2 | 35% |
Recent deploys
- api-gatewayv2.14.112 min ago
- worker-poolv1.9.01 h ago
- billingv3.2.43 h ago
Illustration with sample data. Every project gets dashboards built around its own services.
How the work goes
- 1
Call and access
You tell us what runs and which failures hurt most. We look at what is already being collected.
- 2
Plan and price
What we measure, which alerts are needed and where they go, how long data is kept. Scope and price are fixed before work starts.
- 3
Deploy and tune
The stack is installed from code. Then we watch the alerts for an agreed period and remove the noisy ones, so every remaining alert requires action.
- 4
Handover or support
You get dashboards, rules and runbooks in your repository. Under a support agreement we also respond to the alerts ourselves.
Questions
- Prometheus
- VictoriaMetrics
- Grafana
- Loki
- Grafana Alloy
- Alertmanager
- Blackbox Exporter
- node_exporter
- kube-state-metrics
- Telegram
- Slack
Describe the task — get a plan and a price
Write what you have and what you need. We answer within one business day with questions or a concrete proposal.